AI SHARE OF VOICE
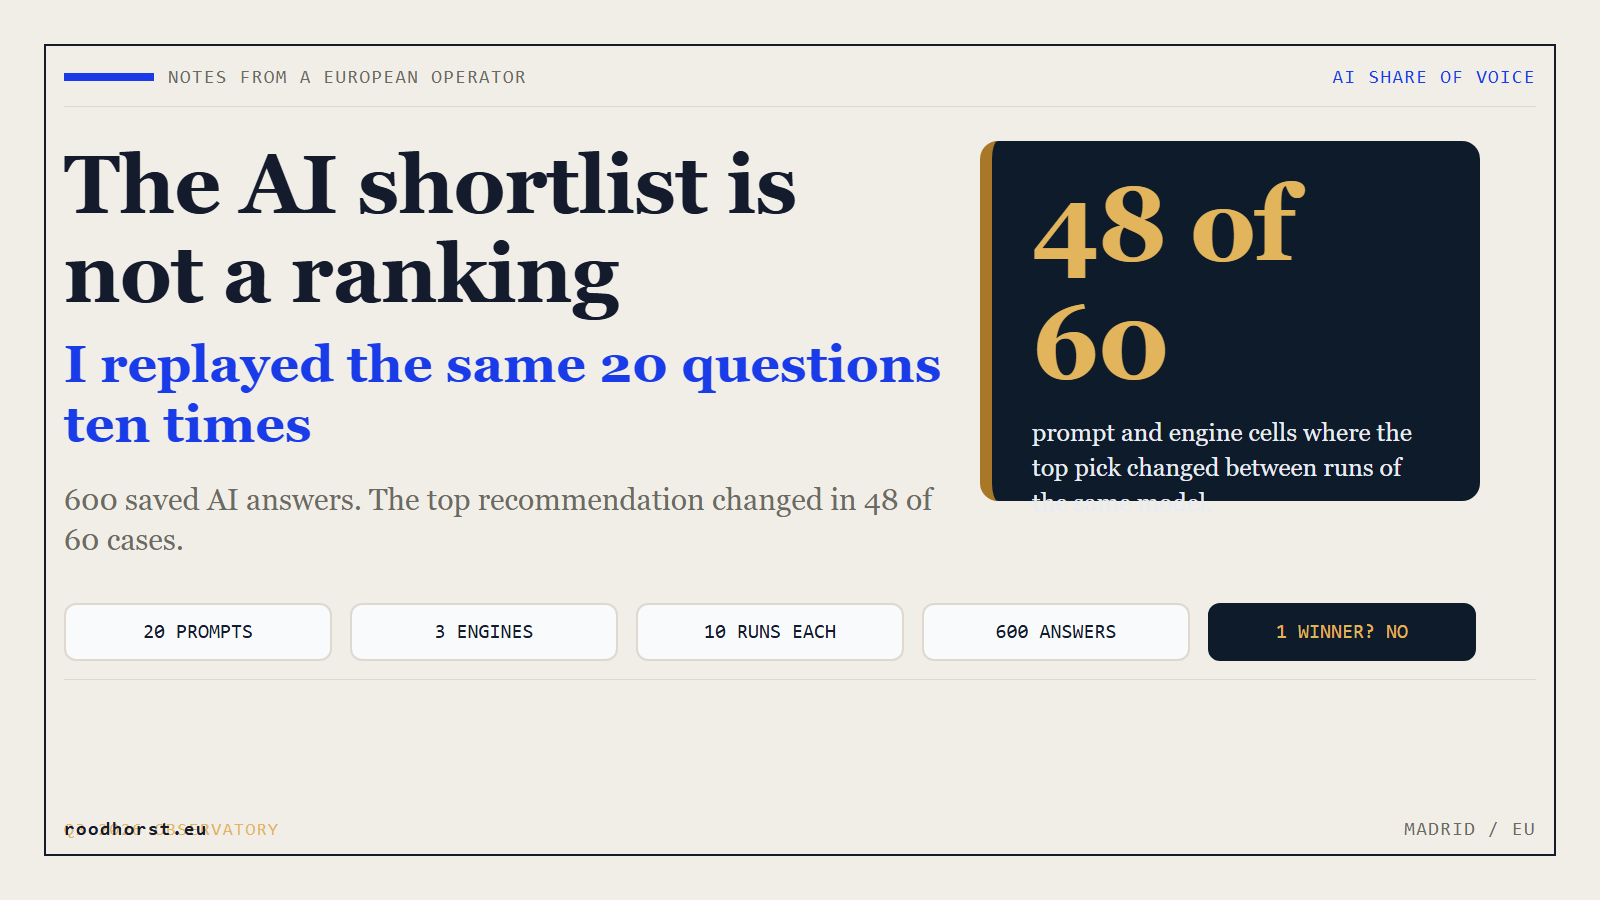
I replayed the same twenty questions ten times on three engines. In 48 of 60 cases the top recommendation changed. The AI shortlist behaves like a distribution channel with a confidence interval, and almost nobody publishes one.
Every AI visibility number you have seen this year, mine included, is one sample. The question nobody in this market asks is how stable that sample is. So I went back to the raw archive behind the AI Asset-Manager Observatory, took the twenty frozen buyer prompts and the ten saved runs of each, and replayed 600 completions. Then I counted something simple: how often the same firm took first place. The answer is uncomfortable for anyone selling a one-off AI shortlist, and it is the most useful thing I have measured this year.
What I measured, and what it is not
The setup is the one behind the quarterly readings in the AI Asset-Manager Observatory: twenty frozen buyer and allocator prompts, a fixed list of European asset managers with matching aliases, and first place defined as the firm named earliest in the answer. What is new here is repetition. Each prompt was asked ten times per engine, and all 600 completions are saved, so any number below can be traced to a file.
Three engines are in this cut: Gemini 2.5 answering with Google Search on, and Mistral and DeepSeek answering from memory, ten runs each. That gives 60 prompt and engine cells and 600 completions.
Two honest limits before the findings. This is the English cut, so it says nothing about the language gap yet. And because the three engines are different models, a grounded-versus-memory comparison here is suggestive rather than isolated. The within-engine test that closes that gap is the next edition.
Finding one: the top of the list moves
Only 12 of the 60 cells produced the same first-place firm in all ten runs. That is 20%. In the other 48, the top recommendation changed at least once inside a single sitting. On average the most common winner took 71.8% of its ten runs, and 22 of the 60 cells landed below 70%.
The extreme cases are the ones worth sitting with. On a pension allocator question, ten runs of one engine produced eight different firms in first place, and the most common of them appeared in two runs out of ten. On a dividend and income question, one grounded engine produced six different first-place firms, and the most common one took two runs out of ten. Neither of those readings is a ranking. Both would have been published as one if I had run the prompt once and stopped.
Finding two: the engine that reads the web is the least stable
Gemini with live search produced the same first place in all ten runs on one prompt out of twenty, and twelve of its twenty cells landed below 70% agreement. The two memory engines were steadier: Mistral was unanimous on eight of twenty prompts and averaged 87.5% stability, DeepSeek on three of twenty and 66%.
That is the mechanism, not a quirk. An engine answering from memory repeats what it was trained on, so it repeats itself. An engine that reads the live web answers from whatever it retrieves that day, so it varies with the retrieval. Those live readings are the ones that decide what a buyer sees in a chat window this morning, and they are the least reproducible.
It also reframes the mode flip the Observatory has carried with a caveat since August. The winner changing between a memory answer and a live answer is not a bug in the study. It is the measurement working, and this run shows how much movement sits inside each mode separately.
Finding three: the top three is the honest unit, and it is still loose
If the first place is a coin toss, the top three is the smallest unit worth reporting. So I measured how much two runs of the same prompt share. The mean overlap between the top three of any two runs, on a 0 to 1 scale, was 0.78 for the steadiest memory engine, 0.45 for the other memory engine and 0.41 for the live-web engine.
Read that as a firm trying to use the number. Across ten runs of a prompt on the live-web engine, an average of 8.25 different firms appeared in the top three at least once. An average of 0.5 firms were in the top three in all ten runs. So “in the top three” is a membership rate over repeated runs, not a position you hold.
Finding four: the engines do not agree with each other either
Only three of the twenty prompts produced the same market leader across all three engines. Thirteen produced the same leader on at least two. The remaining prompts have no shared answer at all, on the same question, in the same language, in the same week.
That is the part that should change how this number gets bought. A single engine, asked once, is a sample of a sample. What a firm actually owns is a membership rate across engines and runs, and a trend across quarters on a frozen panel.
| Buyer question | Gemini (live web) | DeepSeek (memory) | Mistral (memory) |
|---|---|---|---|
| Long-term equity fund | 50% 3 winners | 70% 4 winners | 90% 2 winners |
| Sustainable and ESG portfolio | 60% 5 winners | 40% 5 winners | 100% 1 winner |
| First-time retail investor | 60% 3 winners | 70% 3 winners | 90% 1 winner |
| Pension allocator, European equities | 70% 3 winners | 20% 8 winners | 90% 2 winners |
| Fixed income and bond funds | 100% 1 winner | 80% 2 winners | 90% 2 winners |
| Independent active managers | 60% 5 winners | 70% 4 winners | 100% 1 winner |
| Multi-asset or balanced | 60% 4 winners | 30% 5 winners | 90% 2 winners |
| Index and ETF products | 50% 2 winners | 100% 1 winner | 60% 2 winners |
| European small-cap funds | 50% 5 winners | 60% 5 winners | 80% 3 winners |
| Thematic funds | 50% 3 winners | 90% 2 winners | 70% 2 winners |
| Spanish advisor, fund providers | 90% 2 winners | 100% 1 winner | 70% 3 winners |
| German asset managers | 70% 2 winners | 100% 1 winner | 100% 1 winner |
| Dutch or Benelux retirement | 50% 3 winners | 50% 3 winners | 90% 2 winners |
| Emerging-market funds | 40% 5 winners | 40% 5 winners | 100% 1 winner |
| Fees and performance | 90% 1 winner | 70% 2 winners | 100% 1 winner |
| Institutional mandates | 80% 2 winners | 90% 2 winners | 100% 1 winner |
| Boutique managers | 30% 4 winners | 80% 2 winners | 70% 3 winners |
| Wealth manager portfolios | 90% 2 winners | 60% 2 winners | 100% 1 winner |
| Dividend and income funds | 20% 6 winners | 70% 4 winners | 100% 1 winner |
| Most innovative with AI | 70% 3 winners | 30% 5 winners | 60% 2 winners |
What this changes if you are buying the number
Four questions, in order. How many runs per prompt, and were they saved. Which engines, in which mode, at which model version. Is the panel frozen, so this quarter is comparable to the last one. And is the headline a membership rate over runs, or a rank that came from one sample.
If a report cannot answer those four, it is a screenshot with a price list. If you get a single reading that says your firm is fourth, the honest interpretation is that it was somewhere in the top ten on that day, in that engine, with that phrasing. That is still worth having, but only as a starting line. I would treat anything under three runs per prompt as a mood, not a measurement.
The reason this matters commercially is that the number is now a budget line, and the firms that buy the strongest version of it will be the ones whose agencies can show a trend rather than a snapshot. The rest will re-measure next quarter, get a different answer, and conclude that the whole category is noise. That conclusion would be wrong, but the way this number is usually sold is what will cause it.
What I am changing in my own index
This study started as an audit of my own work. The Observatory already labels every number by run and freezes the panel for exactly this reason, and the September reading already carries a caveat that no completions were collected after 17 August. What was missing was the size of the noise band, printed next to the number.
So the next edition of the index publishes stability alongside reach, the within-engine mode test replaces the confound caveat with a measurement, and the language cut gets the same treatment before any delta between two months is described as real movement. That is the difference between publishing a number and publishing a number someone can act on, and it is the same standard I would apply inside a firm: one reading tells you where you might be, repeated readings tell you what you own.
It also connects to the rest of the picture. Being cited matters more than being mentioned, and which sources the engines cite is a slower and more durable signal than any single shortlist position. Permission is the floor: what the crawlers are allowed to read decides whether any of this is even possible. And the work that moves the number is the same work that moves distribution, which is why it belongs in how distribution actually gets built rather than in a separate AI project.
What would make this wrong
Twenty prompts is a sample of buyer questions, not the population of them. Ten runs shows that the noise exists but does not size it precisely, and a stability rate is itself an estimate. The mode comparison carries model identity with it until the within-engine test runs. Models change under the same name, so a rerun in six months measures that quarter, not a permanent law. And this is what engines say, not how funds perform: nothing here rates a manager, and it should never be read that way.
The honest part
I am publishing a finding that weakens the headline use of my own flagship number, which is the point. A shortlist position is a sampled, moving estimate. What survives repetition is whether a firm is in the set at all, across engines and languages, quarter after quarter. That is the thing worth buying, and it is measurable: it takes a frozen panel, repeated runs, and someone who will show you the raw files. That is what an AI visibility audit is built to do, and what you can run yourself with the dataset below.
Notes from a European operator
If your AI shortlist position came from a single run, what you own is a photograph. The thing that compounds is the trend, and trends only exist if someone repeats the measurement on a fixed panel. Ask any agency for their run count before you ask for their number.
Sources, data and method
- The dataset behind every number here: ai-shortlist-repeatability-data.csv, one row per prompt and engine with run counts, distinct winners and stability.
- The frozen prompt set, the firm roster and the matching rules are published with the study that produced them: the AI Asset-Manager Observatory.
- Engines and modes: Gemini 2.5 with Google Search on (live web), Mistral and DeepSeek answering from memory. Ten saved completions per prompt per engine, 600 in total.
- First place means the firm named earliest in the answer, counted against a fixed alias list, the same rule used in the Observatory readings.
This study sized the noise band. The method that keeps you inside it is a separate piece of work: five decisions that turn a reading into a rate, starting with the panel you freeze before the first run.
3 thoughts on “The AI shortlist is not a ranking”