AI SHARE OF VOICE
Five decisions stand between you and a number you can defend, and four of them are made before you collect an answer. I replayed 600 saved completions to find out which decision actually changes the reading, and which one is mostly decoration.
How to measure AI share of voice comes down to five decisions, and four of them are made before you collect an answer. The base run behind the Observatory collected 487 answers across three engines, named 104 asset managers, and gave the top ten firms 42% of every mention. Every one of those figures is a choice as much as a reading: the buyer questions, the firm list, the engines, the languages, and how many times you repeat the run. This is the method I run, the two decisions most reports skip, and the file behind every number below.
A shortlist position is a rate, not a position
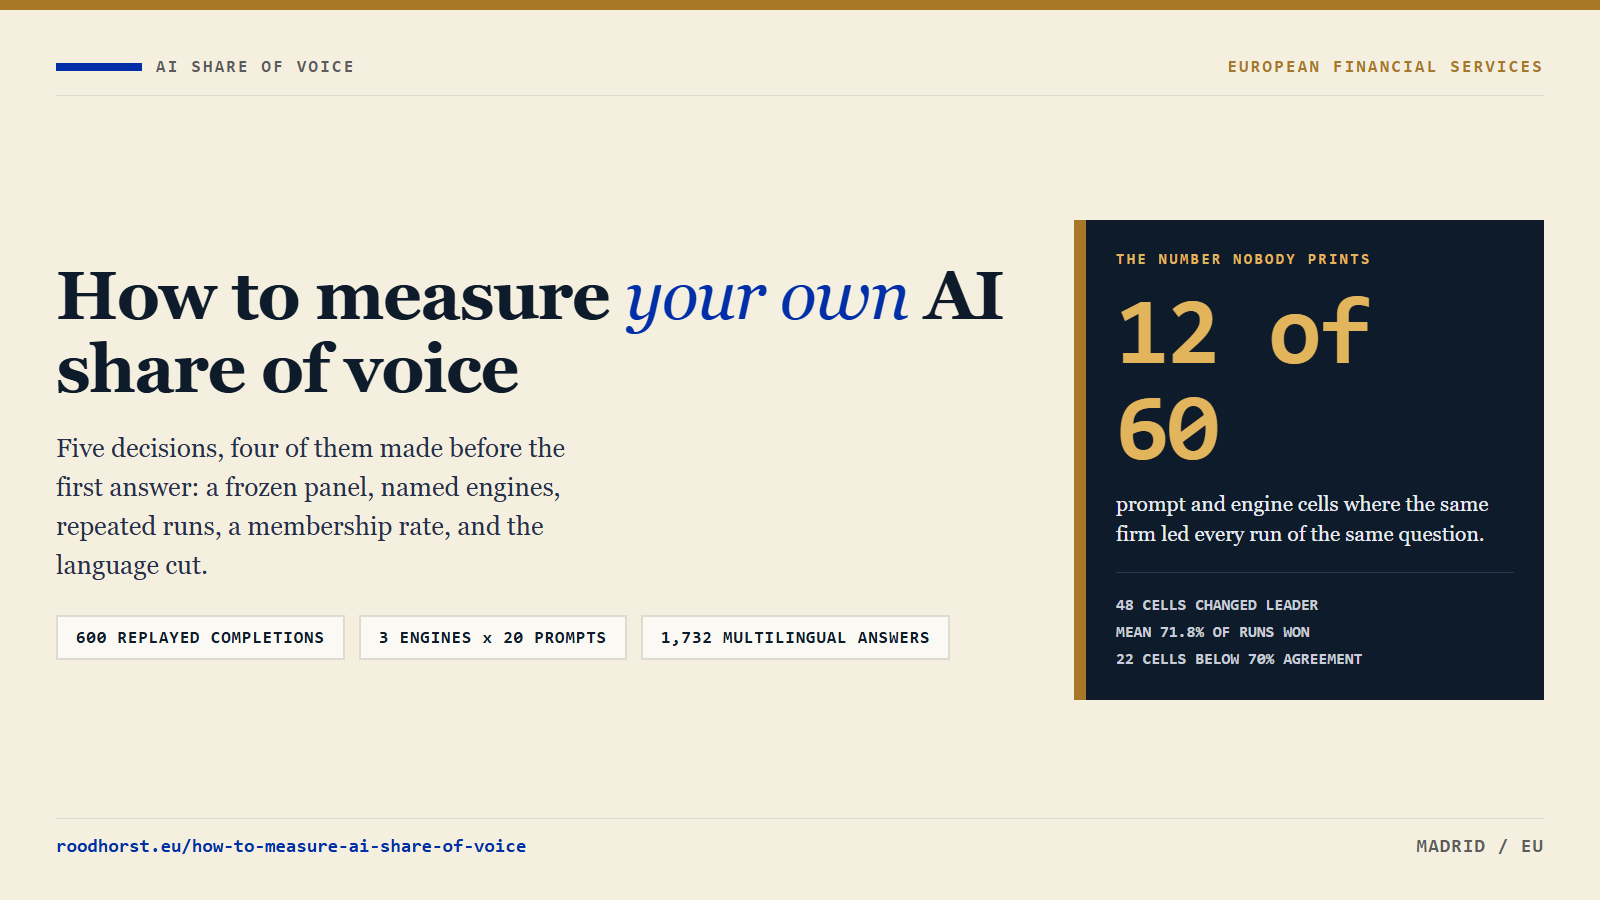
There is no point building a method around a number that moves on its own. I took the twenty frozen prompts the Observatory already uses, replayed ten saved completions per prompt per engine, and counted how often the same firm took first place. Only 12 of the 60 prompt and engine cells produced one leader in all ten runs. In the other 48 the top recommendation changed inside a single sitting, and the most common winner across all sixty cells took 71.8% of its ten runs. One prompt produced eight different firms in first place.
That finding, from the 600-replay that sized the noise band, is the reason the rest of this method looks the way it does. A firm named in four runs out of ten that is later named in seven has improved, even when the ranking graphic looks identical. A firm that jumps from fourth to first between two single readings has learned nothing about itself. So the number worth building is a membership rate over repeated runs, and everything below is how to produce one that somebody else could reproduce.
The order matters, which is the part that gets skipped. Most measurement work starts with a dashboard and works backwards to a question. This starts with two fixed lists, and the dashboard is the last thing built, not the first.
Decision one: freeze the panel before you freeze the number
Two things get frozen, and both are boring. The question set: twenty buyer and allocator prompts, written once, saved, and reused every quarter without edits. And the firm list: 104 asset managers with their aliases mapped, so a mention of a brand, a subsidiary and a legal name all resolve to one row before anything is counted.
Nothing about the panel should be clever. It should be small enough to explain in a sentence and fixed long enough to compare two quarters. The base run named 104 firms, 86 of them European and 18 global, and on a question written for a European buyer 18.4% of the mentions still went outside the region. That leakage is a property of the retrieval layer, and you only see it because the roster is fixed. When the roster changes between readings, the change in the roster arrives disguised as movement, and you spend a quarter explaining your own spreadsheet instead of your market.
Alias matching is where most home-made versions break. The instrument you are measuring does not respect your brand architecture: it writes the name it retrieved, which may be the legal entity, the trading name, a sub-fund label or an abbreviation that only exists in one language. If those land in different rows, a firm can cut its mentions in half without anything changing in the world. Fix the mapping once, publish it, and apply it to every run.
The 104-firm panel behind the quarterly Observatory ships with the prompts and the matching rules, so the starting point is not something you have to invent. Copy the shape, or build the same shape for your own category, which takes an afternoon rather than a project.
Decision two: name the engine and the mode, every time
An engine that reads the live web and an engine answering from memory are two different measurements, and the same question gets two different answers. In the replay, three of the twenty prompts produced the same leader across all three engines. Ten more produced a leader that at least two engines shared. The remaining seven had no shared answer at all, on the same question, in the same language, in the same week.
So the report names the model, the version and the mode, every time. A grounded reading measures what is retrievable today. A memory reading measures what was absorbed during training. Both are real, they answer different questions, and they are not interchangeable. That is also why the Observatory keeps its grounded and recall readings in separate columns rather than averaging them into one comfortable number.
The practical consequence is a rule about single-engine reporting. One engine, one mode, one run is a screenshot. One engine, one mode, ten runs tells you how stable that engine is on your question. Three engines across both modes tells you what a buyer might see, which is the only version of this number that maps onto a client experience.
Decision three: repeat until you can tell movement from noise
Ten runs per prompt per engine is what I use, which comes to 600 completions for three engines and twenty prompts. The run count is not a virtue on its own, and the replay shows why: even on the steadiest engine, two of twenty prompts still failed to agree on a leader across ten runs, and on the engine that reads the live web, twelve of twenty did.
One prompt, one engine, the same ten runs, reported two ways
Both statements describe the same file. Only one of them can carry a decision, and the difference is a run count and a saved archive. That is why the method stores the raw completions rather than the summary: a stability figure is only checkable if somebody can count the runs behind it.
In practice this is the cheapest part of the exercise and the one most often bought out. Running the same twenty prompts ten times is a script and a spreadsheet. Reading the output is where the work sits, because a firm has to decide what counts as a mention, what counts as first place, and how a three-line answer that names six managers gets scored. Whatever those rules are, write them down before the first run, because they will be tested the moment the answer contains an unexpected name.
Decision four: report the width, not just the core
The finding I did not expect is how wide the surface is once a prompt is repeated. Across ten runs, an average of 9.1 different firms appeared in the top three at least once on one memory engine, and 8.25 on the engine that reads the live web. The number that appeared in the top three in all ten runs was 0.65 and 0.5 respectively. The steadiest engine looked tidier from the outside and was not: 4.6 firms passed through its top three, and 1.85 of its three slots were held by the same names every run.
Read the two numbers together and the report writes itself. The core is the handful of firms that hold a place every time, and it is far smaller than any league table suggests. The surface is everyone who rotates through, and for a firm trying to get in, the surface is the addressable set. A measurement that publishes only a top ten hides the eight to fourteen names competing for the same slots, and those are the names a campaign is actually up against.
It is also the most useful pair of numbers to take into a budget conversation. “We hold no place in the core and we appear in the surface on four of twenty prompts” describes a position and a job to do. “We are ninth” describes a graphic. That is why this measurement sits inside the distribution engine this number feeds rather than in a separate AI project with its own dashboard.
Decision five: cut by language before you call a movement real
One market, one language, one reading is not a trend. I ran the same twenty questions in five languages and collected 1,732 answers: 591 in English, 342 in Spanish, 270 in German, 269 in Dutch and 260 in French. Europe held between 80 and 83% of the mentions in every language. The leader did not. First place in Spanish, German and French went to a different firm than first place in English, and the Dutch reading put another name first again.
For a firm with one English site, that is the whole point of the exercise. The English reading is one of five queues and the one with the most competition in it. The five-language run carries the full cut and the method behind it, and the rule I take from it is short: do not describe a change as movement until the same direction of travel shows up in at least two languages, and in two consecutive quarters.
The language cut also protects you from the most common false positive in this category. A swing in the English reading between two quarters can be a retrieval change, a model change, or a genuine shift in who is being recommended, and the English cut alone cannot tell those apart. Two languages with the same direction is weak evidence of the third explanation and strong evidence against the first two.
What a defensible report has to state, and what it does not claim
Six fields carry the whole thing. The questions, verbatim. The firm list and the matching rule. The engines, versions and modes. The run count per prompt. The period, with real dates. And the rate itself, reported as membership across runs, with the stability printed next to it rather than in an appendix.
| Field | What it fixes | What it decides |
|---|---|---|
| The question set | Twenty buyer and allocator prompts, verbatim, frozen | Whether this quarter is comparable to the last one |
| The firm panel | 104 firms with alias matching applied before counting | Whether the reading is about your market or the model’s habits |
| Engine and mode | Model, version, live web or memory | Whether you measured retrieval or training data |
| Runs per prompt | Ten saved completions per prompt and engine | Whether a movement can be separated from the noise |
| The rate and its stability | Membership across runs, with agreement stated beside it | Whether anyone can act on the number at all |
Everything beyond those six fields is decoration, and two claims are outside this method entirely. It says nothing about whether a firm is any good, and nothing here should be read as a view on a fund, a strategy or a manager. And it cannot see the layer underneath it. Whether an engine is allowed to fetch a page at all is a separate question with a separate answer, and which firms may be crawled at all is a different audit with a different fix. In a shortlist reading, a firm that is invisible for a robots.txt reason looks exactly like a firm that is invisible for a content reason, and those two problems have opposite solutions.
The time-series is the point of all this. The Observatory is quarterly, and a quarterly series only becomes useful when two consecutive readings exist on the same panel, with the stability printed beside both of them. Until then, every comparison is between two photographs, and the honest report says so.
The honest part
I built this method because a single reading of my own flagship number could not survive a second look. Freezing the panel, repeating the runs and printing the stability beside the reach is what turns a claim into something a client can check. The two files behind this piece are published below, so you can run the method yourself or hand it to whoever produces your numbers. The audit I run on a frozen panel is the same sequence applied to your category, and the first question I ask any firm is how many runs its current number came from.
Notes from a European operator
Ask for the run count before you ask for the position. Whoever can show you the raw file behind the number, quarter after quarter, on a panel that has not changed, is the only one who can tell you whether anything actually moved.
Sources, data and method
- The re-cut dataset behind this piece: ai-share-of-voice-stability-by-engine-2026-09.csv, one row per engine, with the stability figures and the top-three width.
- The blank sheet for running the same method yourself: ai-share-of-voice-measurement-template.csv, one row per prompt, engine and run.
- Source run: 600 saved completions, three engines, twenty frozen prompts, ten runs each, from the archive behind the AI Asset-Manager Observatory.
- Base run figures: 487 answers across three engines, 104 firms named, 86 European and 18 global, the top ten taking 42% of mentions, and 18.4% of mentions leaving the region on a European question.
- Stability figures: 12 of 60 cells with one leader in all ten runs, 48 that changed, a mean 71.8% of runs won by the most common leader, 22 cells below 70% agreement, and eight distinct leaders on a single prompt.
- Per engine: Gemini 2.5 grounded, one unanimous prompt of twenty, a mean 62% of runs won, and 12 of 20 cells below 70% agreement. DeepSeek recall, three of twenty unanimous, 66%, and 8 of 20 below 70%. Mistral recall, eight of twenty unanimous, 87.5%, and 2 of 20 below 70%.
- Top-three width: 9.1, 8.25 and 4.6 firms appeared in the top three at least once across ten runs, against 0.65, 0.5 and 1.85 that appeared in all ten.
- Language run: 1,732 answers, 591 English, 342 Spanish, 270 German, 269 Dutch and 260 French, with Europe holding 80 to 83% of mentions in every language.
- Limits: twenty prompts is a sample of buyer questions, not the population of them. Ten runs shows the noise exists without sizing it precisely, and a stability rate is itself an estimate. Models change under the same name, so a rerun measures that quarter rather than a permanent property. Nothing here rates a manager, a fund or a page.
1 thought on “How to Measure Your Own AI Share of Voice: The Method I Run”